Introduction to Technical Trading

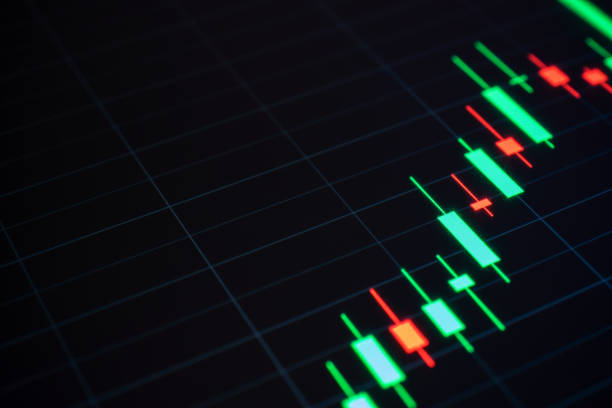
In momentum, one type of technical trading, a trader looks for signs of a stock about to explode. This is when a sizeable unidirectional movement in price occurs on a high volume over a long period, which could lead to a profitable outcome. The momentum trader already has a technical analysis by looking at stock charts to find signs of a breakout.
The indicators used in momentum trading represent only a tiny portion of the chart and graph patterns available to technical traders.
Different types of trading
Here’s an overview of the most common types of equity trades before we get into technical trading.
- Scalping A scalper makes dozens to hundreds of trades a day to “scalp” or make a small profit on each trade.
- Momentum trading: Momentum traders look for stocks that move significantly in one direction and have high volumes. These traders try to ride the momentum to their desired profit.
- Technical Trading: Technical traders focus on charts and graphs. They look for lines on graphs of stocks or indexes that may indicate Buy or Sell signals.
- Fundamental Trading Fundamentalists are traders who trade companies based on fundamental analysis. This involves examining corporate events, such as earnings reports or stock splits that have occurred or will occur, reorganizations, or acquisitions.
- Swing Trading Swing traders are fundamental traders that hold their positions for more than one day. Most fundamentalists are swing traders since it takes several days or weeks for a change in fundamentals to cause a sufficient price move to allow the trader to make a profit.
The novice trader may experiment with all these styles. Still, they should choose a niche that matches their investing experience and knowledge with a style they feel motivated to dedicate further research, education, and practice. There are entire textbooks devoted to every class, although some titles, like “Day Trade Online” and “How to Get Started in Electronic Day Trading,” are unclear about the type of trading they advocate.
Exploring Technical Trading
Technical trading is an encompassing style of trading that does not limit itself to trading. A technician will use historical trading patterns to predict the future of stocks. Meteorologists and economists use the same approach: they look to the past to gain insight into the future. We all know that forecasts are often inaccurate.
Some technical indicators may only be helpful for specific industries, while others only apply to stocks of a particular classification. Some technical indicators are valid only for specific sectors. Others may only apply to stores that fall into a certain category (for instance, supplies in a range of liquidity and capitalization). Some indicators are only relevant to particular stocks because of the patterns highly traded stocks may exhibit over time.
Technical indicators like momentum are not the best way to determine when to buy and sell. Although they do not provide accurate timing predictions, they can be used to identify stocks suitable for more detailed analysis using Level 2. Technical analysis is a good starting point. Still, it does not always predict future performance.
This discussion is limited to indicators applicable to individual stocks. Many hands might be helpful to predict an index or a data-component=” link,” data-ordinal=” 1,” data source=” inlineLink,” and data type=” internalLink.” This discussion will only cover indicators that apply to specific stocks. Many other indicators could be used to predict an industry or index.
Common groups of technical indicators:
- Relative Strength Index: This measures a stock’s recent performance compared to its historic strength by comparing current and historical closes. If the RSI is above 80, it may be a sign of overbought, indicating a signal to sell. The RSI below 20 may indicate that the stock is oversold, which would be a good buy signal.
- Range Trading: A graph plots highs, lows, and closing prices over time. Support and opposition are then drawn at the bottom and the top of the range. A breakout is when the price moves above or below the field for a short period.
- Pattern Analyses: This is the most accessible form of technical analysis to understand. Price charts are examined for patterns that have appeared historically in the stock in question or marks observed in many stores throughout history. Most commonly seen designs include head-and-shoulders patterns, triangles up or down, rounded tops and bottoms, cups-and handle formation.
- The Trend Analysis: A highly complex and mathematical analysis of trends looks at both short- and long-term trends and attempts to identify cross-overs where prices cross their long-term mean. Moving averages are long-term averages that smooth out a range of prices over a certain period. They do this by averaging data points and plotting the smoothed lines against the stock price. Moving average convergence divergence is used to identify crossovers and divergence, convergence, and overbought or oversold conditions.
- Analysis of Gap: An opening price that is higher or lower than the previous day’s closing price can be due to company news published overnight or other factors. The gap trader looks at the performance of a stock above or beneath its opening price, which could indicate future movement. The trader may make decisions that are more similar to those of a momentum trader rather than a technical analyst.


Post Comment