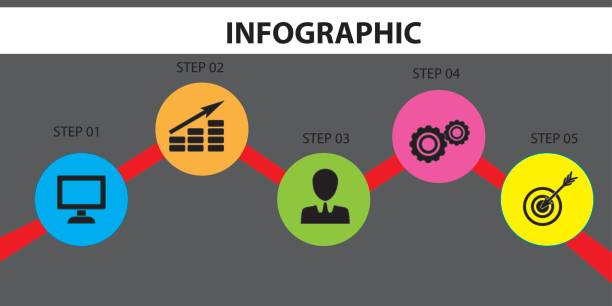
HOW TO PERFORM A MULTI-TIMEFRAME ANALYSIS + 5 STRATEGIES
Multi-timeframe Trading is a trading strategy where traders combine different trading timeframes in order to optimize their chart analysis and improve their decision-making.
Multi-timeframe trading aims to increase the profitability of each trade by trading signals that are long-term in a shorter timeframe. In the next article, we’ll give concrete examples to explain what it means.
Traders typically use two timeframes, one higher and one lower. The higher timeframe allows traders to gain a better understanding of the market sentiment and direction by analyzing a longer-term chart. The higher timeframe is used to establish a bias (long, neutral, or short), and then traders look for trading opportunities in their lower timeframe in that direction. The lower timeframe will be used to manage and time trading positions.
TOP-DOWN VS. BOTTOM-UP
When performing a multi-timeframe analysis, traders often make the mistake of starting their research with the lowest time frame and working their way up. This is called a bottom-up approach.
By starting your analysis with your lower timeframe, where you are placing your trades, you create a very one-dimensional and narrow view. You miss the point of a multiple-streaming study. Many traders adopt a particular market direction on their lower timeframe and then look for ways to confirm that opinion on the upper timeframe.
The top-down approach is recommended. The top-down analysis begins on a higher timeframe, where a trader can get an overall sense of market sentiment and the context of the trend. They also become aware of key price levels and hurdles. The trader will then look for trading opportunities on the lower timeframe based on the perspective of the higher timeframe. The trade fits into the overall narrative of the chart.
What timeframes should I use?
When you start trading on multiple timeframes, the first thing that comes to mind is what timeframes you should use. Please keep it simple at first, especially for beginners. It is not necessary to reinvent the wheel.
The table below shows the most popular timeframe combinations. For consistency, I suggest sticking with one variety for a long time. You can then gain experience trading with the timeframes you have chosen and determine if they are right for you.
Avoid switching between different timeframes because this creates confusion and noise in your trading.
Before changing timeframes, stick with one combination of timeframes for 30 to 50 tradings.
MULTI TIMEFRAME STRATEGIES
We can now start using our timeframes once you have chosen a combination of timeframes. What should we be looking for in a timeframe higher than the current one?
Traders can select from different “cues” for higher timeframes (or confluence factors). You can choose the best multi-timeframe chart strategy based on your preferred charting analysis.
Here are a few factors that can be expected when using a longer time frame approach.
Breakout Levels
levels of support and resistance are some of the concepts that are most often used on higher timeframes. Support and resistance levels are used by traders on higher timeframes to look for either a bounce of a horizontal long-term level or a break.
Below is an image of the Daily timeframe with a marked resistance level. The trader will identify the story in their higher timeframe and then switch to a lower frame to look for bullish trading opportunities.
The image below shows a 1H timeframe following the breakout of the resistance. After the flight, the price trended upwards, and traders would have been wise to adopt a bullish attitude and look for trends that continue in a bullish direction.
BOUNCE LEVELS
In addition to looking for a breakout on a higher timeframe, traders may also opt to search for a bounce from a resistance or support level. The image below shows that the strong resistance level held multiple times in the 4H higher timeframe. A trader may adopt a negative trade sentiment as long as the price cannot close above the resistance level. The higher timeframe’s bearish bias is useful for finding short-term trading opportunities, especially after seeing the deceleration signal (smaller candles).
A Head and Shoulders pattern is visible in the lower 15-minute timeframe at the moment of the deceleration 4H candle. A trader may have a plan to short the market after a successful breakout or retest of the neckline, keeping in mind the bearish bias on the higher timeframe.
After the breakout and retest, the price dropped sharply. The decelerating candle and the strong resistance on the higher timeframe allowed the trader to adopt a negative bias early. Meanwhile, the lower timeframe enabled the trader to time his short trades effectively.
Trading signals at a lower timeframe allows the trader to optimize both the reward ratio and the holding time. This is because the trade has a tighter stop and an aggressive entry while using a larger target in the context of a higher timeframe.
HIGHS AND LOWS
Some traders choose to use local highs or lows instead of long-term resistance and support levels for their multi-timeframe strategy.
The overall approach is, at this moment, similar to the previously discussed support-and-resistance level strategy.
The trader will first look for a previous high or low that is strong. In the picture below, the price initially overshot the previous high. The strong bearish momentum entered, and the price fell below high. This pattern is called a fakeout in technical analysis (or trap) because the breakout fails and traps long breakout traders.
This signal on the higher timeframe will provide us with a negative bias, which we will then carry down to our lower timeframe.
The price builds a flag breakout pattern on the lower timeframe shortly after the fallout signal. Flags are some of the most common trend continuation patterns. Breaking the trendline is a common way to signal the beginning of a trend.
After the breakout of the flag, a downtrend began.
The higher timeframe signal duration is used to the best of its ability. The accuracy of the prediction is usually lower with a longer period. Trading the fakeout on the higher timeframe directly results in a significantly longer holding period. Holding times can be drastically reduced by using a lower timeframe for timing the entry and exit. The trader’s risk is reduced the shorter the trading period. Snap Herplex Hub


Post Comment